
“Sell in May and Go Away” is an old stock market adage drawing attention to the seasonal weakness that typically occurs during the summer months relative to other time periods of the year. The origin is believed to date back hundreds of years to when investors would step away to enjoy the summer with loved ones.

While the S&P 500’s third quarter return of -3.3% played to the script of seasonal weakness, there may have been an overriding factor influencing performance to consider.1 The most likely culprit being rising interest rates, as during the quarter the market began to reprice assets to reflect “higher (interest rates) for longer”. As a result, over the course of the third quarter intermediate and longer interest rates moved upwards. It’s worth noting that despite the S&P 500 having a negative return during the third quarter, for the year through September 30th, 2023, the S&P 500 has generated a return of +13.1% .1
There are a few explanations for what may have driven this recalibration of expectations as it relates to interest rates. Inflation is continuing to normalize towards the Federal Reserve’s target, but at a much slower pace than desired. One of the drivers of stickier inflation is the continued resilience of the labor market and the consumers appetite to spend, especially on services like travel and eating out.
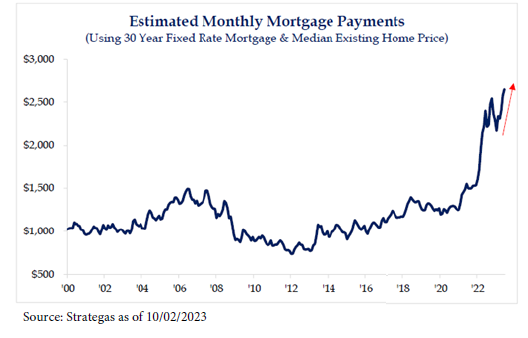
As consumers, we see higher longer-term rates transmitted back into the economy via rates on credit cards, auto loans, and mortgages, for example. Mortgage rates rose to levels not seen in the last 20 years, with the Freddie Mac 30-year rate ending the third quarter at 7.3%.2 The effect upon consumers transcends beyond home sales, which have fallen dramatically, to other areas of spending. Though we do note many consumers either own their home or have locked in lower mortgage rates.
It will be interesting to see which effect wins the contest from here for the remainder of the year, higher interest rates versus the traditional seasonal patterns. The good news is we have started the fourth quarter, which is traditionally the best quarter when looking at average returns dating back to 1928 as shown in the opening chart.2
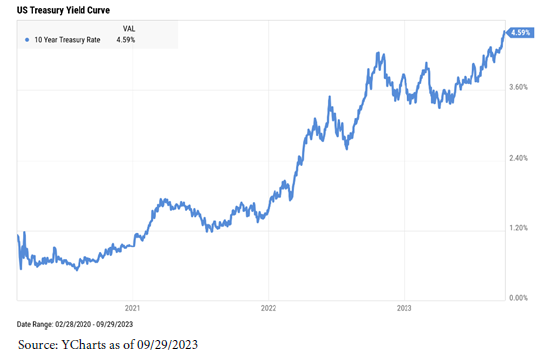
Unfortunately, markets do not go straight up, even though markets have a long-term upward movement with positive returns over long data sets. But fortunately, nominal interest rates do not either. The rise of the 10-year US Treasury is not likely to continue nor persist for an extended period as we’ve seen recently, though we do believe we are in a long-term period of higher rates. In other words, higher for longer may be a bit lower from here, but more elevated from the ultra-low environment put in motion in 2020 by the response to the global pandemic.
With the ongoing discord in Congress, the upcoming presidential election, and the rising geopolitical tension, we fully expect interest rates and inflation to remain critical topics going forward. It is fair to expect it will have an impact on the psychology of the market and potentially lead to bouts of volatility.
The economy and the labor market seem to be doing well despite the higher rates. Our economy is still growing, and a broader recession has not yet appeared, though it is certainly possible to see a mild, brief recession in the future. The unemployment level remains low, noting that the level of full employment is not indicative of a pending recession.
We remain constructive on the markets in the long term and are relieved to see a normalizing yield environment. Sub-inflation rate fixed income yields, as we’ve experienced in the recent past, are not a good thing for investors. So having a real rate of return (yield less inflation) has been a welcome normalization process we think not just for savers or fixed income investors, but all markets. However, having said that, we look forward to a positively sloped yield curve and a less hawkish Federal Reserve. We think this will eventually come to pass, and maybe in a shorter time than markets expect.
Thank you for your continued trust and the opportunity to serve you. Have a wonderful Fall.
John Cheshire
Chief Investment Officer
Bryce Goldbach
Portfolio Manager & Wealth Strategist
10/12/2023
CITATIONS
[1] https://ycharts.com/indices/%5ESPX
[2] www.strategas.com “Quarterly Review in Charts Mon. Oct 2, 2023”
[3] https://fred.stlouisfed.org/series/DGS10 “Market Yield on U.S. Treasury Securities at 10-Year Constant Maturity, Quoted on an Investment Basis”
[4] https://ycharts.com/charts/fundamental_chart “10 Year Treasury Rate”
DISCLOSURES
This report was prepared by Asio Capital, a federally registered investment adviser under the Investment Advisers Act of 1940. Registration as an investment adviser does not imply a certain level of skill or training. The oral and written communications of an adviser provide you with information about which you determine to hire or retain an adviser. Form ADV Part 2A & 2B can be obtained by visiting https://link.edgepilot.com/s/849e5eac/xrcqBzdw_UKkcOoJYdvT8g?u=https://adviserinfo.sec.gov/ and search for our firm name. Neither the information nor any opinion expressed it so be construed as solicitation to buy or sell a security of personalized investment, tax, or legal advice. This is prepared for informational purposes only. It does not address specific investment objectives, or the financial situation and the particular needs of any person who may receive this report.
S&P 500 measures the performance of 500 widely held stocks in US equity market. Standard and Poor’s chooses member companies for the index based on market size, liquidity and industry group representation. Included are the stocks of industrial, financial, utility, and transportation companies. Since mid-1989, this composition has been more flexible and the number of issues in each sector has varied. It is market-capitalization weighted.