
It’s been a grueling first half of the year, one of the worst since 1932, with the S&P total return at -19.96% as of June 30, 2022. 1 & 2 The irony is that the economy is still performing decently, with the labor market still having strength. These have been a very unusual few years since the Covid shutdowns. We had a slightly downward GDP print in Q1 and may well have another in Q2, which would technically mean we are already in a recession. Though we would also note recessions are normal and if we are in one now, it does not appear to be a severe one at this time. While recessions can make some investors feel uneasy, we believe they are a normal part of our market cycle.
We have thought for some time that we have not fully experienced the effects of the Covid lockdowns, nor the unusual amount of stimulus that was injected to keep the economy functioning. If anything, we have been impressed by the resiliency of the American economy and consumer.
It seems that we now can begin to see the historical effects of this unprecedented set of events with some clarity in hindsight. Here are our general observations:
- Shutting down a large vibrant economy, in conjunction with other global economies, produces large supply chain shocks and distortions.
- Mandated lockdown of citizens creates huge labor distortions.
- Injecting huge sums of financial stimulus is a blunt tool and creates distortions in asset pricing, leading to bubbles, as evidenced in the pricing of cryptocurrencies, SPACs, NFTs, and the rise of meme stocks.
- Creating large sums of money and injecting it into the economy, via monetary policy and debt, is inflationary (as was pointed out by the famous economist Milton Friedman).
Now with all the hype that we get in the constant stream of news flow competing for our attention, it’s easy to lose sight of the big picture. We believe we have had a huge economic shock and disruption over the last 3 years, and the markets are struggling to sort it all out. Monetary policy works with a lagged effect, and we are starting to see the outcomes.
We believe the economy to be generally healthy and working out the long-term effects of the 4 points observed above. In our opinion, the banking system is in great shape with banks healthy and well capitalized. Travel and leisure activities continue to be in demand by consumers and we see employment as still generally strong.
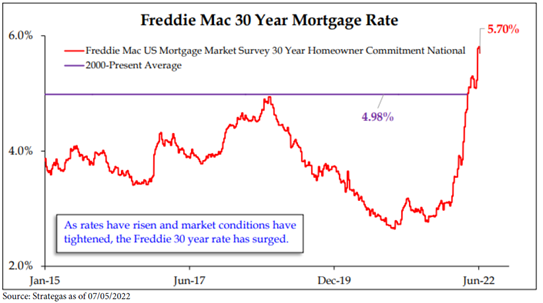
In our opinion, the stock and bond market have adjusted with a great amount of velocity due to an inflation spike that has been one of the steepest we have ever seen. The velocity of this rate shock can be seen by how quickly rates increased in the 30-year mortgage.
Markets simply take their time, sometimes in a volatile way, to try and price assets appropriately. We would denote a big disconnect in the messages of the stock and bond markets signaling of the outcome. To us, the stock market is trying to price in extended inflation, as valuations have fallen. So, it would seem to us that stocks, as a long duration asset, may adequately reflect a higher long-term inflation rate. Yet, the bond market seems to tell us that inflation rates will return to normal. It is hard to believe that the bond market thinks we will have any form of longer-term inflation above a normalized 2% Fed target with a 10-year US Treasury yield of 2.92% at the end of Q2, June 30, 2022. 3 So, which one is right?
We believe that from here inflation will normalize to some new decelerated level, and we think we see signs of peaking inflation in both the commodity prices and the housing markets, two places of trailing rampant price inflation. We also think that the supply chain distortions will continue to abate and normalize, further reducing inflation pressures. Technology will also likely continue to exert a deflationary effect and a rise in all standards of living, as it has been in the past decades. As these effects happen, we think that that the economy will resume robust growth, and markets will begin to reflect that scenario.
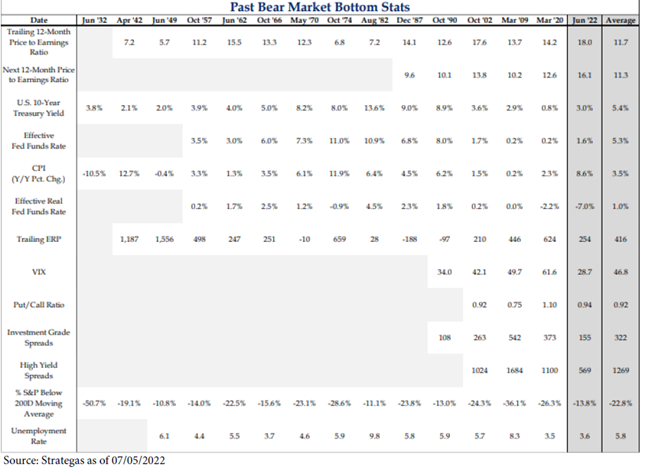
With the stock market’s 20% sell-off, we note that after this threshold has been reached, in all prior situations since WWII, the average forward 1 year return has been 24%.4 Unfortunately, we also note that historically we have a good chance of a bit deeper sell-off before those returns have been achieved. We have provided a historical tabulation of this data at the end of this quarterly note for your perusal.
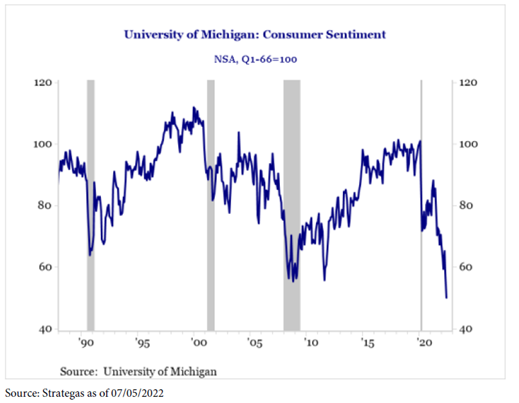
The most bullish chart to us, form a contrarian point of view, is the record 30 year low in consumer sentiment. Historically, the lows of consumer sentiment typically have coincided with the bottom of a recession and hence subsequent recovery.
Though we think we could see more volatility throughout the summer and fall, and possibly a new low in the stock market in that time frame, we do strongly believe we are much closer to the end of this sell-off than its beginning. We think that the bond market could have more pain without having a deleterious effect on stocks at the current pricing of both markets. Looking out at a 1-to-3-year horizon, we are extremely constructive of future returns and current valuations of many securities.
John C. Cheshire
Chief Investment Officer
07/09/2022
Citations
[1] www.dbresearch.com “Thematic Research: Monthly Chartbook” 06/21/2022
[2] www.strategas.com “Quarterly Review in Charts Tue. Jul. 5, 2022”
[3] https://tradingeconomics.com/united-states/government-bond-yield
[4] www.gsam.com “Market Minute – Context on Bear Markets”
Disclosures:
Please remember to contact Asio, in writing, if there are any changes in your personal/financial situation or investment objectives for the purpose of reviewing/evaluating/revising our previous recommendations and/or services.
Past performance is not indicative of future results. The opinions expressed herein are those of Asio Capital LLC (“Asio”) and are subject to change without notice. This material is not financial advice or an offer to sell any product. All investments and investment strategies involve risk. Asio reserves the right to modify its current investment strategies and techniques based on changing market dynamics or client needs.
Forward looking statements cannot be guaranteed. The information herein is correct to the best of the knowledge of Asio as of the date indicated unless otherwise noted and is subject to change without notice, may not come to pass, and does not represent a recommendation or offer of any particular security, strategy, or investment. This information is confidential and for the use of the intended recipients only. It may not be reproduced, redistributed, or copied in whole or in part for any purpose without the prior written consent of Asio.
Information obtained from third party sources is believed to be reliable but is not guaranteed for accuracy or completeness. Moreover, you should not assume that any discussion or information contained in this commentary serves as the receipt of, or as a substitute for, personalized investment advice from Asio. There can be no assurance that the future performance of any specific investment, investment strategy or product will be profitable or prove successful.
The US Index of Consumer Sentiment (ICS), as provided by University of Michigan, tracks consumer sentiment in the US, based on surveys on random samples of US households. The index aids in measuring consumer sentiments in personal finances, business conditions, among other topics. Historically, the index displays pessimism in consumers’ confidence during recessionary periods, and increased consumer confidence in expansionary periods.
Treasury yield is the return on investment, expressed as a percentage, on the U.S. government’s debt obligations. Looked at another way, the Treasury yield is the effective interest rate that the U.S. government pays to borrow money for different lengths of time
Asio is an SEC registered investment adviser located in Lexington, Kentucky. Registration with the SEC does not imply a certain level of skill or training. More information about Asio including our advisory services, fees and objectives can be found in our ADV Part 2, which is available upon request. ASC-2207-01