
One challenge as an investor is recognizing that returns are lumpy. Ideally, to achieve an +8% annualized return, stocks would glide upwards on a smooth path of +8%, +8%, +8% each year, for example. Unfortunately, the market is often more like a roller coaster with a return path of +15%, -12%, +25% to achieve that 8% annualized return. In the positive return years, it is fun, but much less so in the more challenging years. As we look back on 2022, it will be remembered less fondly by investors but also may serve as a potential catalyst for better days ahead.
To put the year into perspective:
- The S&P 500’s total return was -18.1%, the 7th worst year since 1926.1
- The Bloomberg Barclays US Aggregate lost 13.0%, its worst year on record.1
- This was only the 5th time since 1926 that both stocks and bonds declined in the same year, and the first time in that period both have fallen by over 10%.1
2022 was characterized by weaker and weaker rallies, then new lows. The markets seemed to make an orderly descent as the Federal Reserve marched rates progressively higher to fight inflation. As rates rose, stocks and bonds began to discount in the new higher rate environment with lower and lower prices. However, there is a positive silver lining. Lower prices imply higher future rates of return.

We observed the US Dollar continued to strengthen relative to other currencies, as investors sought safety during less certain times. The Russia/Ukraine conflict and China’s strict zero-Covid policies and government actions all contributed to the ongoing congested supply chains. As a result, investor sentiment in 2022 at times mirrored levels consistent with past periods of extreme despair, such as the Financial Crisis in 2008/2009. With these developments, most investors and investment professionals began to forecast an imminent recession in 2023.
As we enter the new year, we believe we are witnessing a structural regime change and that 2022 may prove to be the crucible market participants needed to begin the new environment. There are 3 main things we see as changing from here:
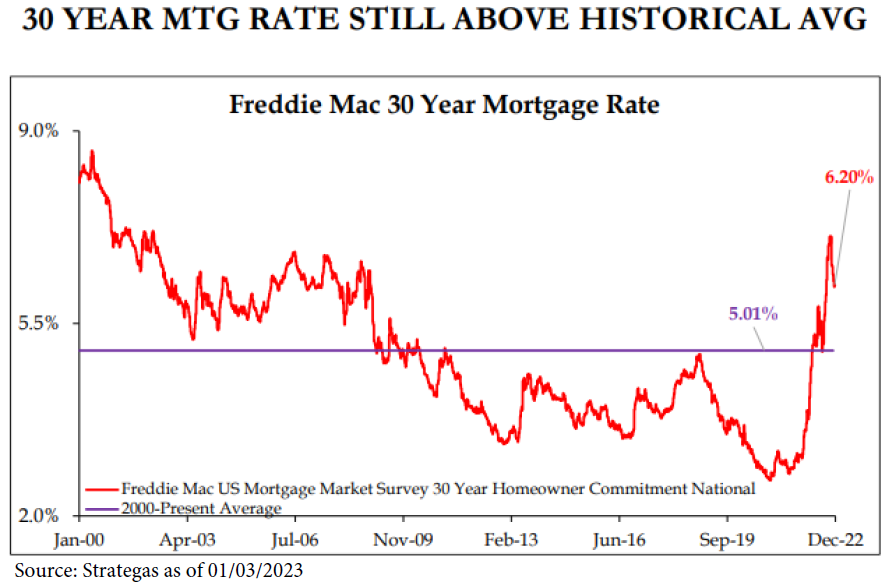
First, the 40-year trend of falling rates is likely over. In our opinion, we are now in a rising rate regime and the shift was (very) swift. While in the near-to-intermediate term, rates may trend lower as the Fed completes their quest to squash inflation, we believe rates will rise slowly over the next decade. This has broad implications for all assets, as a return to a real cost of capital will likely lead to better financial discipline on governmental, corporate, and individual balance sheets. This may prove to be a blessing in disguise for investors in the long term.
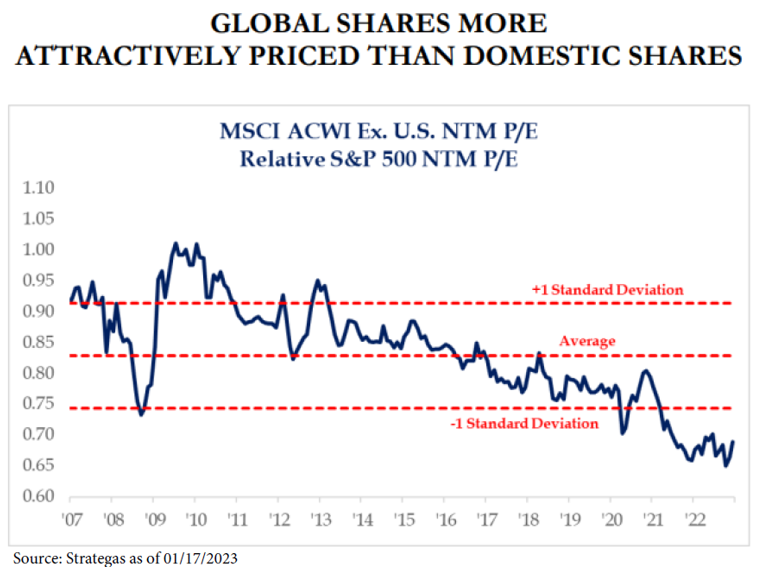
Second, the strength of the USD bull market is likely to moderate, allowing for other global currencies to appreciate relative to the USD. In our view, foreign assets, especially stocks, should prove attractive if this former headwind turns into a tailwind. We find international assets attractive as we look forward.
Third, the dominance of FANG, or FANMAG2, depending on the acronym you prefer, is likely over. Mega cap companies have dominated the indexes in their weight and performance over the last few years. We believe in the years ahead investors will reward companies who deliver profitability and cash flows, versus high growth, low or no profitability companies, due to the rise in rates and the cost of capital.

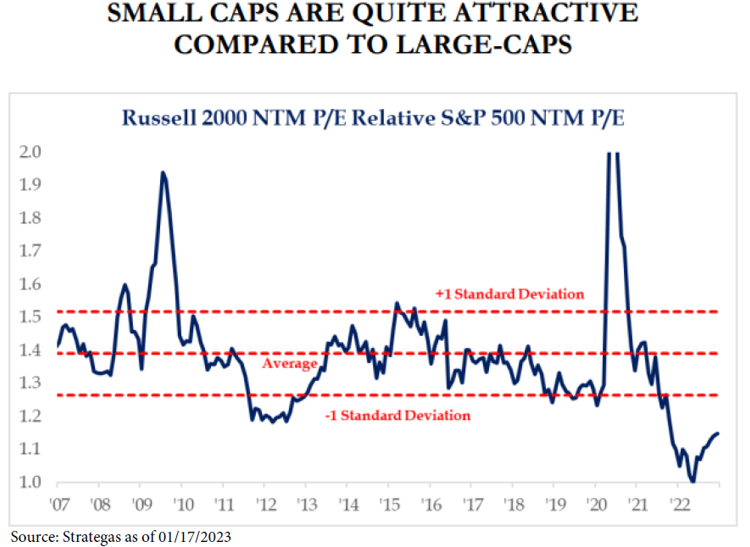
The regime change highlighted will certainly have implications as to how we may allocate on behalf of our clients. From our observation, international equities, as previously highlighted, is an asset class that certainly looks attractive on a relative basis, as do US small cap stocks. Small caps, in our opinion, are both inexpensive and likely to benefit from the shift away from the mega cap company focus of investors. We have been adding to our exposure in US small caps and are starting the new year eyeing foreign markets as a place to implement capital also.
Even though we believe the rate regime has changed and that rates will slowly rise over the next decade, we do anticipate that rates will fall sometime in 2023 or 2024 as inflation rolls over, which has started already and will likely accelerate during the next 12 to 18 months.

In our view, the implication of this for fixed income investors is to get serious about extending duration. Intermediate and shorter-term rates could well be nearing a peak. We would prefer to barbell our exposure to capture the higher yield in the inverted short end of the yield curve, as well as try and lock in intermediate yields further out the curve.
For equity investors, slowing or decelerating inflation likely means a path back to a more constructive return environment. We continue to monitor corporate earnings as downward revisions are likely given higher rates, especially for companies who have higher leverage or maturing debt obligations. However, we also believe that much of that phenomenon has been priced into equity markets over the last year via negative returns.
It is easy to forget, in the barrage of news flow and pundits, that inflation affects corporate earnings in a positive way over a long cycle and that stocks have served as an efficient long-term inflation hedge historically. We believe that the onshoring of manufacturing, resulting from the supply chain disruptions, and focus on moving microchip production to a domestic venue, will have a long-term positive influence on our economy and future investment market return potential.
We are equally glad to see 2022 come to an end, as we are hopeful that 2023 will return to a more normal environment for investors. Given this, we believe forward returns will be attractive from current market levels. We appreciate your continued support and as always, thank you for allowing us to serve you.
John Cheshire
Chief Investment Officer
01/13/2023
Citations
[1] www.ndr.com “Benchmark Review – A year to forget”
[2] www.strategas.com “Quarterly Review in Charts Tue. Jan. 3, 2023”
[3] www.strategas.com “Investment Strategy Report Tue. Jan. 17, 2023”
Disclosures:
Please remember to contact Asio, in writing, if there are any changes in your personal/financial situation or investment objectives for the purpose of reviewing/evaluating/revising our previous recommendations and/or services.
Past performance is not indicative of future results. The opinions expressed herein are those of Asio Capital LLC (“Asio”) and are subject to change without notice. This material is not financial advice or an offer to sell any product. All investments and investment strategies involve risk. Asio reserves the right to modify its current investment strategies and techniques based on changing market dynamics or client needs.
Forward looking statements cannot be guaranteed. The information herein is correct to the best of the knowledge of Asio as of the date indicated unless otherwise noted and is subject to change without notice, may not come to pass, and does not represent a recommendation or offer of any particular security, strategy, or investment. This information is confidential and for the use of the intended recipients only. It may not be reproduced, redistributed, or copied in whole or in part for any purpose without the prior written consent of Asio.
Information obtained from third party sources is believed to be reliable but is not guaranteed for accuracy or completeness. Moreover, you should not assume that any discussion or information contained in this commentary serves as the receipt of, or as a substitute for, personalized investment advice from Asio. There can be no assurance that the future performance of any specific investment, investment strategy or product will be profitable or prove successful.
The Bloomberg Barclays U.S. Aggregate Bond Index is a broad base, market capitalization-weighted bond market index representing intermediate term investment grade bonds traded in the United States. The Index is frequently used as a stand-in for measuring the performance of the U.S. bond market. In addition to investment grade corporate debt, the Index tracks government debt, mortgage-backed securities (MBS) and asset-backed securities (ABS) to simulate the universe of investable bonds that meet certain criteria. In order to be included in the Index, bonds must be of investment grade or higher, have an outstanding par value of at least $100 million and have at least one year until maturity. The S&P 500 Index is the Standard & Poor’s Composite Index and is widely regarded as a single gauge of large cap U.S. equities. It is market cap weighted and includes 500 leading companies, capturing approximately 80% coverage of available market capitalization.
Asio is an SEC registered investment adviser located in Lexington, Kentucky. Registration with the SEC does not imply a certain level of skill or training. More information about Asio including our advisory services, fees and objectives can be found in our ADV Part 2, which is available upon request. ASC-2301-03